Virtual Services Data Dashboard
Miami University Libraries Virtual Services Data Dashboard
August 2021-present
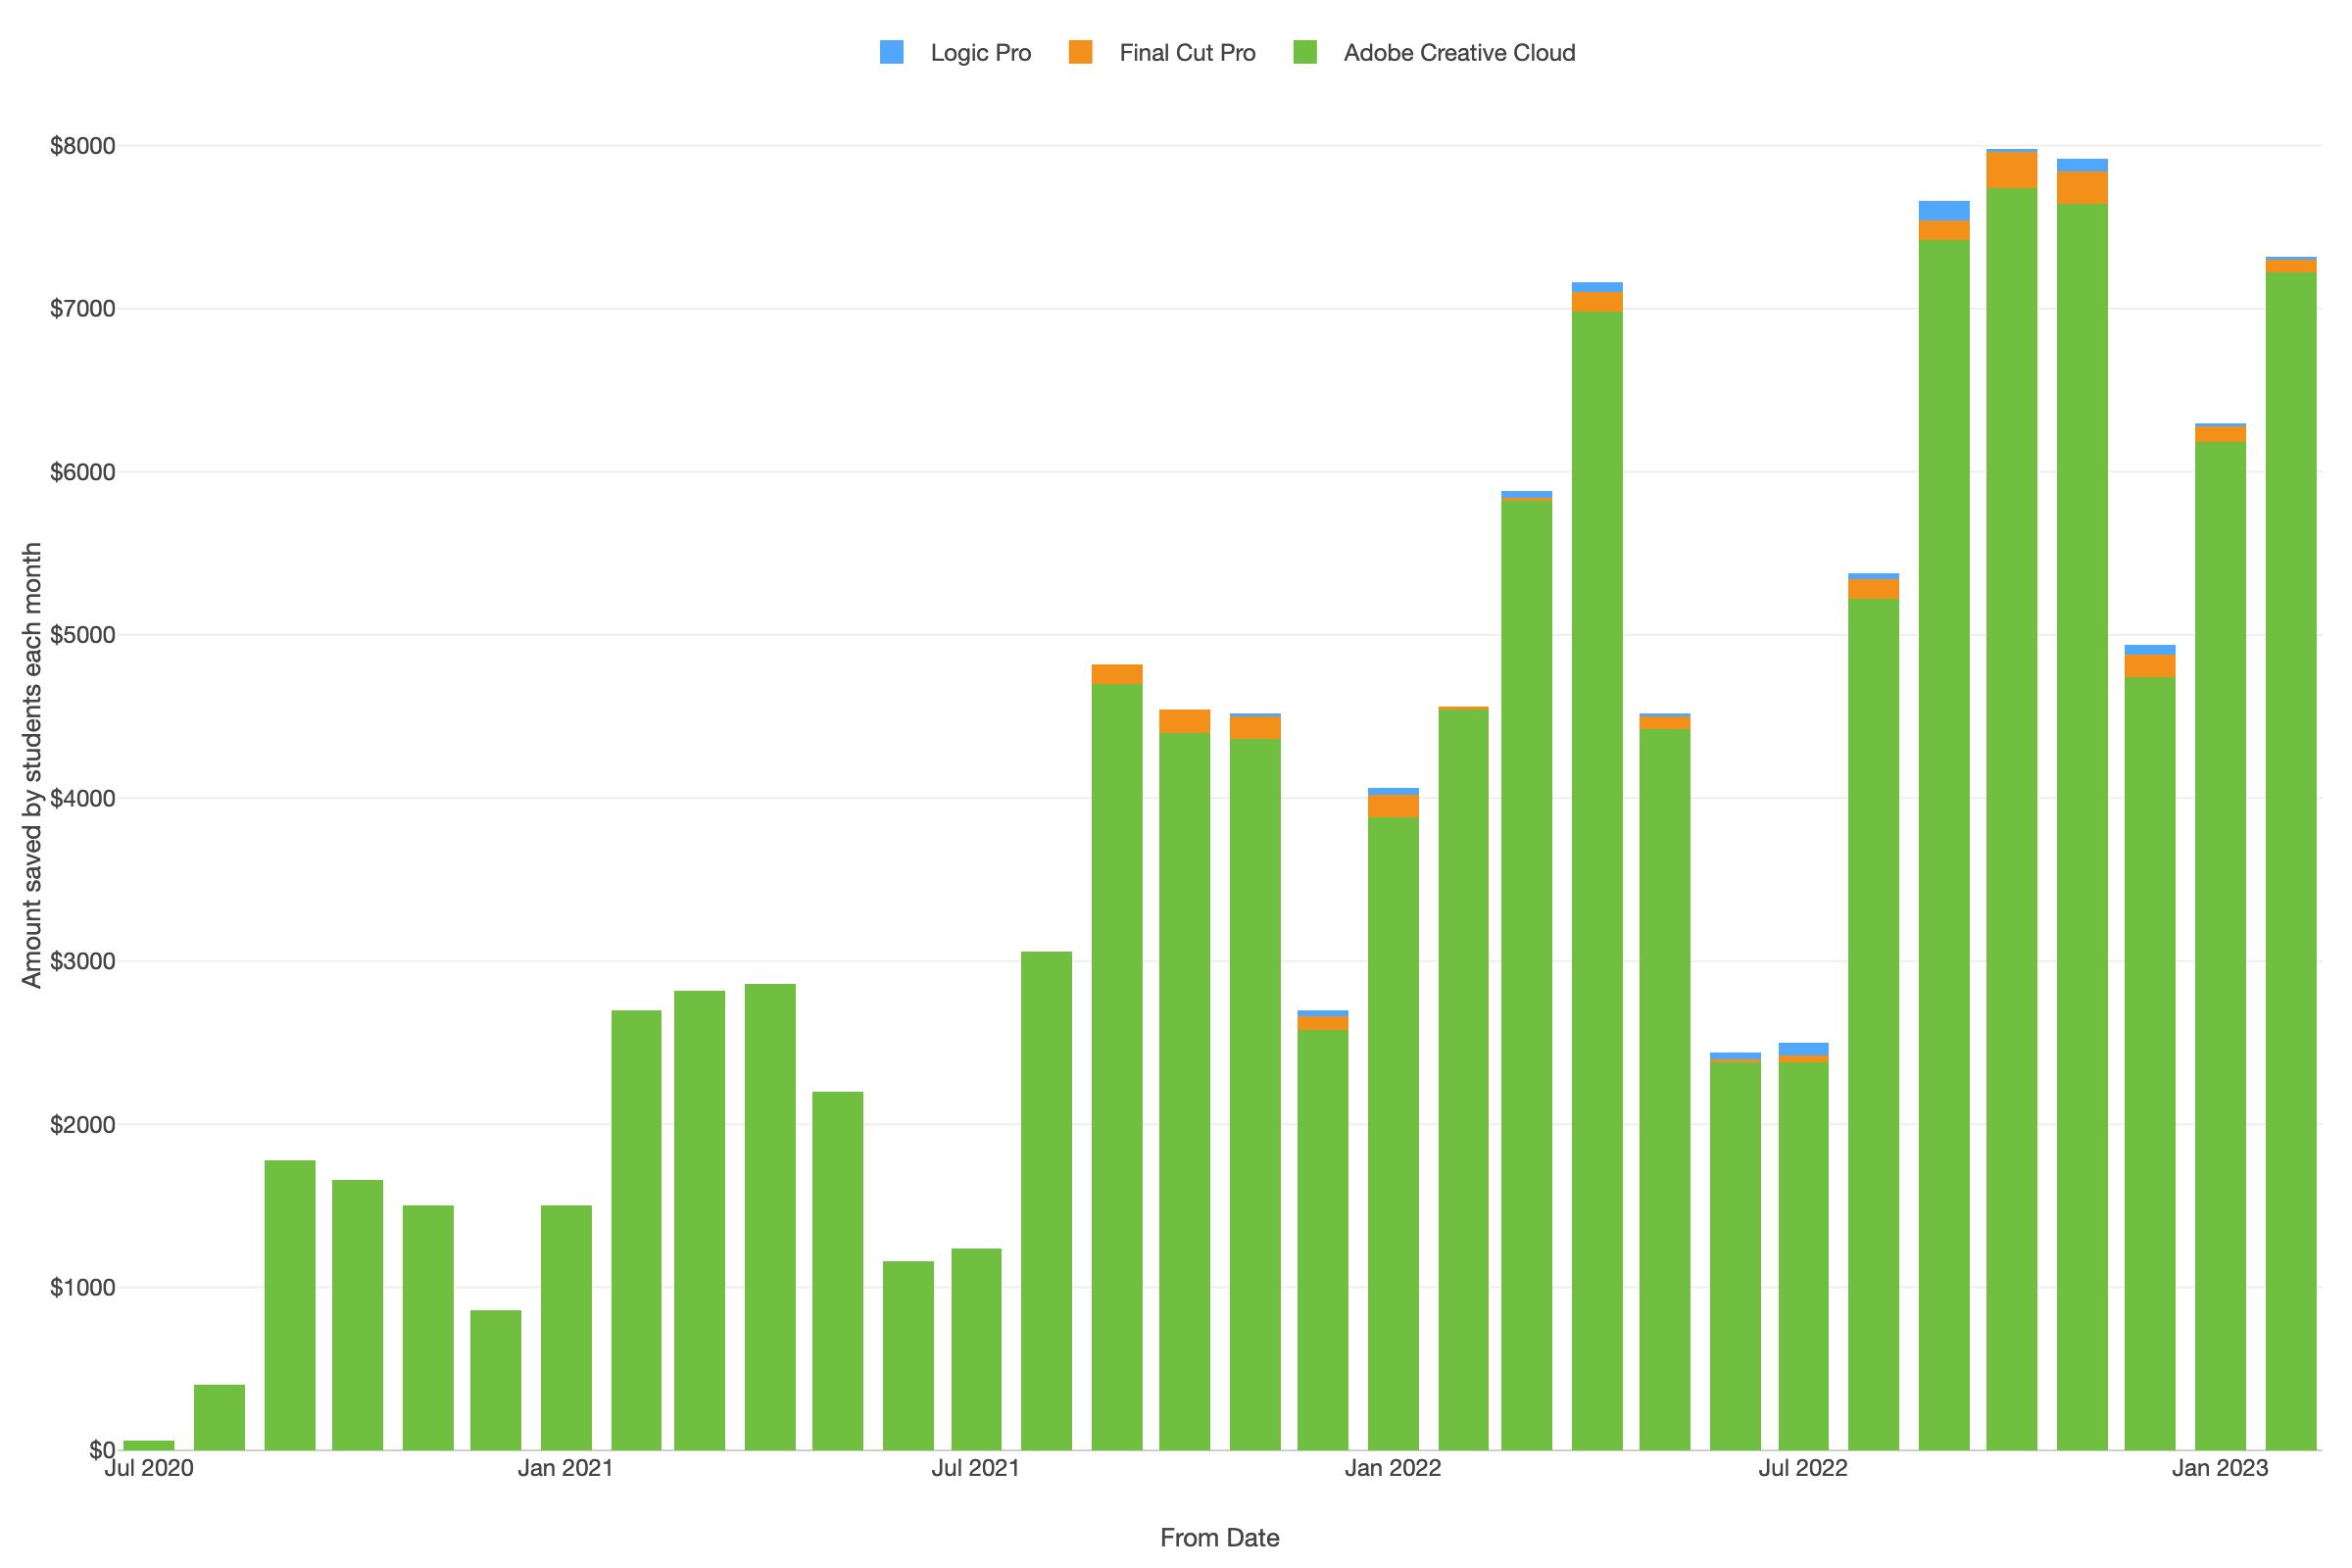
Our libraries have a wealth of data, but it has been difficult for library staff to access, which hampers decision making and our ability to improve library services. Combining the efforts of my primary position with my AY21-22 Strategic Initiatives for Virtual Services service, I focused energy on crafting a workflow for pulling data from our digital systems and bringing the data to a digital dashboard available to the entire staff. Collaborated directly with staff from each department to select the data for analysis and visualization in the dashboard. Examples of this work include:
- Working with Sarah Nagel and Lori Chapin of our Create+Innovate department, I analyzed data from their Makerspace reservation system and survey data the department collected. We were not only able to show the dramatic growth of their services, but were also able to identify issues with their reservation system needing remediation.
- After consulting with the departments on data needs, the plan is to update the data and visualizations each semester.
Related Scholarly Output
- Yarnetsky, J., O’Brien-Withers, R., and Wisneski, R. (2023, October) Data visualization on the (Mostly) Cheap — Or, Lessons Learned from a Data Dashboard Project. [Accepted to present] Core Forum 2023, New Orleans, La.
- Yarnetsky, J., Withers, R., Wisneski, R. (2023, October) Data Visualization Cheap and Easy(-ish) — Or, Lessons Learned from a Data Dashboard Project [Accepted Presentation]. HighEdWeb 2023 Conference, Buffalo, NY.
- Yarnetsky, J. (2022, November) Visualize freely: Data visualization doesn’t have to be difficult and expensive or… Lessons learned from our data dashboard project. [Poster session] ALAO Annual Conference, Columbus, Ohio.
- Yarnetsky, J. (2022, September) Data Visualization made easy using Exploratory [Online Workshop] Miami University Libraries Coffee Hour training program, Oxford, Ohio.